vue3+js实现表格虚拟滚动
VirtualTable.vue
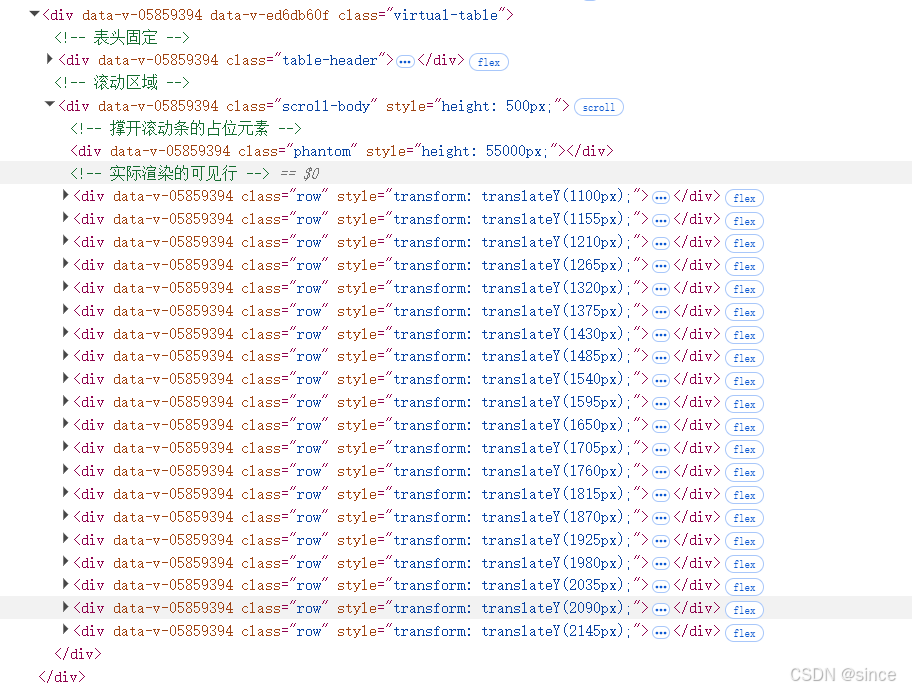
<template><div class="virtual-table"><!-- 表头固定 --><div class="table-header"><div v-for="col in columns" :key="col.key" :style="{ width: col.width + 'px' }">{{ col.title }}</div></div><!-- 滚动区域 --><div class="scroll-body" ref="scrollContainer" @scroll="handleScroll" :style="{ height: scrollHeight + 'px' }"><!-- 撑开滚动条的占位元素 --><div class="phantom" :style="{ height: totalHeight + 'px' }"></div><!-- 实际渲染的可见行 --><div class="row" v-for="item in visibleData" :key="item[rowKey]" :style="{ transform: `translateY(${item.offset}px)` }"><div v-for="col in columns" :key="col.key" :style="{ width: col.width + 'px' }">{{ item[col.dataIndex] }}</div></div></div></div>
</template><script>import { ref, computed, onMounted } from 'vue';export default {props: {dataSource: {type: Array,required: true,},columns: {type: Array,required: true,},rowHeight: {type: Number,default: 55,},bufferSize: {type: Number,default: 5,},scrollHeight: {type: Number,default: 400,},rowKey: {type: String,default: 'id',},},setup(props) {const scrollContainer = ref(null);const scrollTop = ref(0);// 计算总高度const totalHeight = computed(() => props.dataSource.length * props.rowHeight);// 计算可见范围const range = computed(() => {const startIdx = Math.max(0, Math.floor(scrollTop.value / props.rowHeight) - props.bufferSize);const endIdx = Math.min(props.dataSource.length, startIdx + Math.ceil(props.scrollHeight / props.rowHeight) + props.bufferSize * 2);return { startIdx, endIdx };});// 生成可见数据const visibleData = computed(() => {return props.dataSource.slice(range.value.startIdx, range.value.endIdx).map((row, i) => ({...row,offset: (range.value.startIdx + i) * props.rowHeight,}));});// 滚动事件处理const handleScroll = (e) => {scrollTop.value = e.target.scrollTop;};return {scrollContainer,totalHeight,visibleData,handleScroll,};},};
</script><style scoped>.virtual-table {width: 100%;border: 1px solid #e8e8e8;}.table-header {display: flex;background: #fafafa;font-weight: 500;border-bottom: 1px solid #f0f0f0;}.scroll-body {position: relative;overflow-y: auto;will-change: transform;}.phantom {position: absolute;left: 0;top: 0;right: 0;z-index: -1;}.row {position: absolute;width: 100%;display: flex;border-bottom: 1px solid #f0f0f0;box-sizing: border-box;}
</style>
引用
testTable.vue
<template><VirtualTable :data-source="tableData" :columns="columns" row-key="id" scroll-height="500" />
</template><script>import { ref } from 'vue';import VirtualTable from './VirtualTable.vue';export default {components: { VirtualTable },setup() {// 生成测试数据const tableData = ref(Array.from({ length: 1000 }, (_, i) => ({id: i + 1,name: `用户${i + 1}`,age: Math.floor(Math.random() * 50) + 18,address: `地址${Math.floor(Math.random() * 1000)}号`,})));const columns = ref([{ key: 'name', title: '姓名', dataIndex: 'name', width: 150 },{ key: 'age', title: '年龄', dataIndex: 'age', width: 100 },{ key: 'address', title: '地址', dataIndex: 'address', width: 300 },]);return { tableData, columns };},};
</script>
浏览器运行效果